Tropical Cyclone Activities in the Northwest Pacific
Based on 31 years (1979-2009) of tropical cyclone (TC) best track data from IBTrACS (see following table for statistics) and monthly circulation and oceanic SST indices from the National Climate Center (NCC) of China and Climate Prediction Center (CPC) of US, regression equations are devised to forecast the annual number of tropical cyclones of various strengths.
| TD or above (>=22 kts) | TS or above (>=34 kts) | TY or above (>=64 kts) | STY (>=100 kts) | |
| JTWC | 28.7/4.0 | 25.4/3.4 | 16.2/3.3 | 8.6/2.3 |
| HKO | 27.5/3.4 | 24.1/3.4 | 14.2/3.5 | 4.4/2.5 |
| JMA | 24.6/3.5 | 13.8/3.3 | 3.4/2.0 | |
| CMA | 29.0/4.3 | 24.7/3.7 | 14.6/3.5 | 3.7/1.9 |
| JTWC | HKO | JMA | CMA | |
| JTWC | 0.47 | 0.87 | 0.81 | 0.87 |
| HKO | 0.55 | 0.67 | 0.93 | 0.96 |
| JMA | X | X | X | 0.91 |
| CMA | 0.27 | 0.84 | X | 0.63 |
Preliminary analysis with the CMA dataset indicates that the annual number of tropical cyclones (TD or above) correlates fairly well (correlation coefficient ~ 0.7) with a predictor that represents the strength of the subtropical high during the early TC peak season. An additional predictor, which is also an ENSO-related circulation index and has significant correlation with the first one, is included to form a two-variable multiple linear regression equation. The observed (solid line) and fitted (dashed) number of TCs for 1979-2009 is as follows:
Reforecasts (1982-2009) from the NCEP CFS2 can forecast well the first predictor at meaningful lead times, with correlation coefficients of 0.81, 0.80, 0.80, 0.85, 0.89, 0.94 for forecasts initialized in early Jan, Feb, Mar, Apr, May, and June, respectively. The second predictor is a march-april trade wind index. The correlations of the reforecasts are only fair, at 0.74, 0.74 and 0.78 for forecasts initialized in early Jan, Feb and Mar. With these accuracies, the WOHK will consider to issue the forecasts in early Jan and May of a year. The Jan forecast would be a rough estimate which depends entirely on the CFS2 accuracies. For the updated forecast in May, the first predictor can be predicted satisfactorily (correlation 0.89) and the second predictor is already observed. Together with the updated best track and forecast equations should yield more reliable forecasts.
In addition to the number of tropical cyclones, we will also forecast the number of typhoons or above. The work is under way
Related Links:
Seasonal Rainfall over the South China Coastal Areas
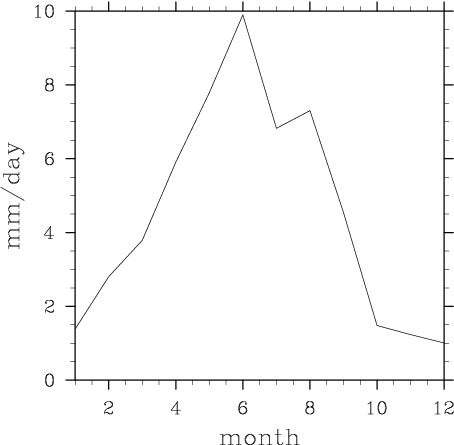
The rainfall near Hong Kong (the land area bounded approximately by latitudes 20-25 N and longitudes 112-117 E) is the target of this forecast. The following figure shows the climatological (1982-2009) monthly rainfall rate over this region.
The forecasts are divided into four seasons: JFM (Jan-Feb-Mar), AMJ, JAS and OND. The skill of the CFS2 to forecast the rainfall rate directly is low, with correlation coefficients of 0.42, 0.12, 0.08 and 0.48, respectively. Therefore, indirect statistical or hybrid statistical/dynamical forecast equations are developed instead.
The JFM rainfall is highly predictable. A single ENSO-related predictor correlates with the JFM rainfall rate at 0.87. Second-order polynomial fit gives 0.93. The predictor is a 3-month (Nov-Dec-Jan) average, and the Jan component has to be obtained from the CFS2 forecasts in early January.